-
Table of Contents
What Metrics to Track for Interactive Content Performance
In the digital age, interactive content has emerged as a powerful tool for engaging audiences and enhancing user experience. From quizzes and polls to interactive infographics and videos, this type of content not only captivates users but also provides valuable insights into their preferences and behaviors. However, to maximize the effectiveness of interactive content, it is crucial to track the right metrics. This article explores the key metrics to monitor for assessing the performance of interactive content.
Understanding Interactive Content
Interactive content refers to any digital content that encourages active participation from users. Unlike traditional content, which is typically passive, interactive content invites users to engage, share, and respond. Examples include:
- Quizzes and assessments
- Interactive infographics
- Surveys and polls
- Games and simulations
- Interactive videos
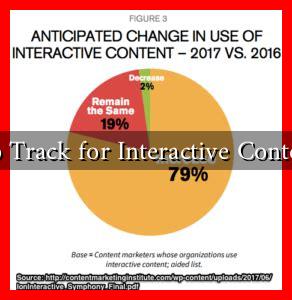
According to a study by the Content Marketing Institute, interactive content generates 2x more conversions than passive content, making it essential for marketers to understand how to measure its success.
Key Metrics to Track
To effectively evaluate the performance of interactive content, consider tracking the following metrics:
1. Engagement Rate
Engagement rate measures how actively users interact with your content. This can include clicks, shares, comments, and time spent on the content. A high engagement rate indicates that users find the content valuable and are willing to participate.
2. Completion Rate
For interactive content like quizzes or assessments, the completion rate is a critical metric. It shows the percentage of users who finish the content compared to those who started it. A low completion rate may suggest that the content is too long, complex, or uninteresting.
3. Conversion Rate
The conversion rate tracks how many users take a desired action after engaging with the content, such as signing up for a newsletter, downloading a resource, or making a purchase. This metric is vital for assessing the ROI of your interactive content.
4. Bounce Rate
Bounce rate indicates the percentage of visitors who leave your site after viewing only one page. A high bounce rate for interactive content may suggest that users are not finding what they expected or that the content is not engaging enough to encourage further exploration.
5. Social Shares
Tracking how often your interactive content is shared on social media platforms can provide insights into its virality and reach. High social shares often correlate with high engagement and can amplify your content’s visibility.
6. User Feedback
Collecting qualitative data through user feedback can provide deeper insights into how your audience perceives the interactive content. Surveys or comment sections can help gauge user satisfaction and areas for improvement.
Case Studies and Examples
Several brands have successfully leveraged interactive content and tracked its performance metrics to enhance their marketing strategies:
- BuzzFeed: Known for its quizzes, BuzzFeed tracks completion rates and social shares to optimize its content. Their quizzes often go viral, demonstrating the power of engagement metrics.
- HubSpot: HubSpot uses interactive infographics and calculators to generate leads. They monitor conversion rates closely, adjusting their content based on performance data to maximize lead generation.
- Netflix: Netflix employs interactive storytelling in some of its shows, tracking user engagement and completion rates to refine their content offerings.
Conclusion
Tracking the right metrics for interactive content performance is essential for understanding user engagement and optimizing marketing strategies. By focusing on engagement rates, completion rates, conversion rates, bounce rates, social shares, and user feedback, marketers can gain valuable insights into their audience’s preferences and behaviors. As interactive content continues to evolve, leveraging these metrics will be crucial for driving success in digital marketing.
For more insights on interactive content and its impact on marketing, consider exploring resources from the Content Marketing Institute.

