
-
Table of Contents
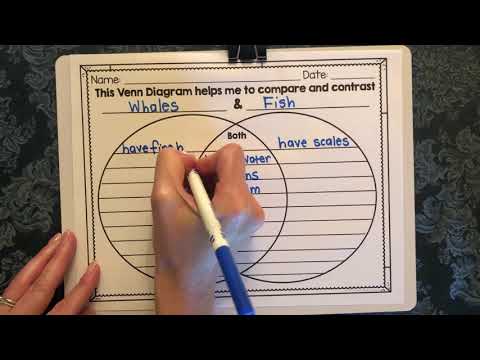
Venn Diagram Compare and Contrast
Venn diagrams are a powerful tool used in mathematics, statistics, logic, and computer science to visually represent relationships between different sets or groups. They are named after the British logician John Venn, who introduced them in the late 19th century. Venn diagrams consist of overlapping circles that show the commonalities and differences between two or more sets. In this article, we will explore how Venn diagrams can be used to compare and contrast different elements, and how they can help us gain a deeper understanding of complex relationships.
Understanding Venn Diagrams
Before we delve into how Venn diagrams can be used for comparison and contrast, let’s first understand the basic components of a Venn diagram. A Venn diagram consists of circles that represent different sets or groups.
. The overlapping areas of the circles show the elements that are common to both sets, while the non-overlapping areas represent elements that are unique to each set.
Example:
Consider a Venn diagram with two circles labeled “A” and “B.” Circle A represents all students who play basketball, while circle B represents all students who play soccer. The overlapping area of the circles would represent students who play both basketball and soccer, while the non-overlapping areas would represent students who play only basketball or only soccer.
Using Venn Diagrams for Comparison
Venn diagrams are an excellent tool for comparing two or more sets or groups. By visually representing the commonalities and differences between the sets, Venn diagrams make it easy to identify similarities and distinctions. This can be particularly useful when analyzing data, conducting research, or making decisions based on multiple criteria.
Case Study:
Imagine a marketing team that wants to compare the preferences of two different customer segments. By using a Venn diagram, they can identify the overlapping preferences of both segments, as well as the unique preferences of each segment. This information can help the team tailor their marketing strategies to better target each group of customers.
Using Venn Diagrams for Contrast
In addition to comparison, Venn diagrams can also be used for contrast. By highlighting the differences between two or more sets, Venn diagrams can help us understand the unique characteristics of each group. This can be valuable in decision-making processes, problem-solving, and academic research.
Example:
Consider a Venn diagram comparing the features of two competing products. The overlapping area of the circles would represent the features that both products share, while the non-overlapping areas would highlight the unique features of each product. This visual representation can help consumers make informed choices based on their specific needs and preferences.
Conclusion
Venn diagrams are a versatile tool that can be used for both comparison and contrast. By visually representing the relationships between different sets or groups, Venn diagrams help us gain a deeper understanding of complex relationships and make informed decisions. Whether you are analyzing data, conducting research, or solving problems, Venn diagrams can be a valuable asset in your toolkit.
For more information on Venn diagrams and their applications, check out this comprehensive guide.


